How accurate is your end of quarter forecast from your sales team? A high performing team will start the quarter and be within 10-20% of the final number. Halfway through the quarter they should be within 5%-10% of the final number and toward the end of the quarter they should be within 2%-5% of the final number. In the early days of a company it’s hard to be this accurate – especially as you’re building your demand-gen engine, bringing a sales team up to speed or entering new markets – but for a sales team that’s been in place for a while – you should be able to achieve these types of numbers.
So you’re a well established SaaS business and you start your quarter with a 3.6X pipeline coverage – life is good. The sales team is forecasting that you’re going to hit your number, you’re looking at the numbers and forecasting the same results and reporting to the c-suite and life is rosy. Or it was. As you get closer to the end of the quarter – you realize you’re going to miss. You’re not going to miss by a little – you’re going to miss by a lot. About 40%. What happened?
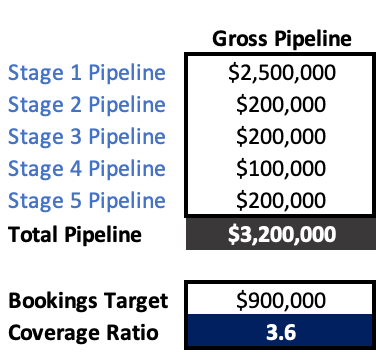
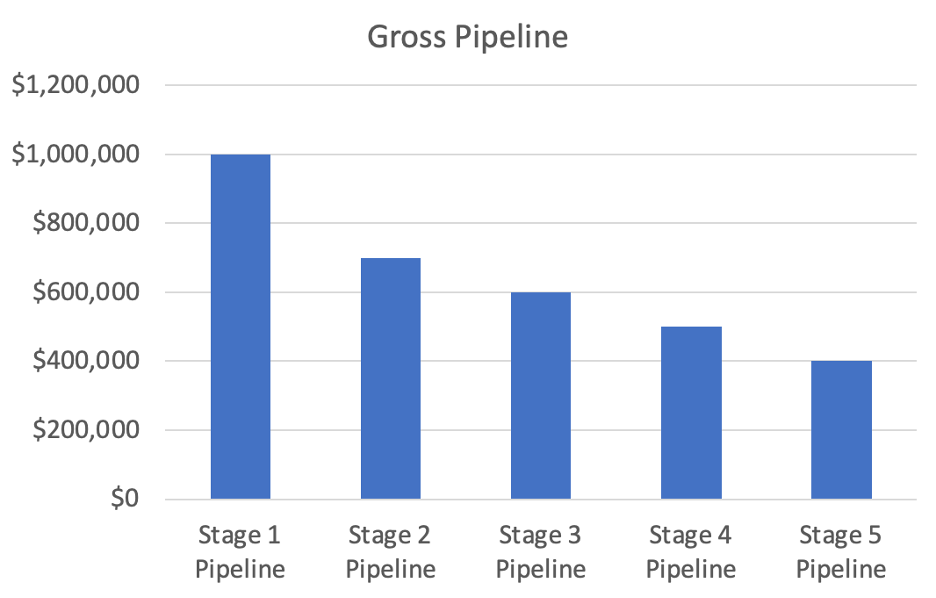
I know too many sales leaders that are just looking at their gross pipeline numbers and ignoring pipeline maturity – doing some simple math and saying “I’ve got enough – I’m going to hit the number.” Let’s say you have a bookings target of $900,000 in ARR for the quarter. If your starting pipeline for the quarter is $3.2M (3.6x) – you would think you would be in good shape. Maybe. Maybe not. It really depends on how mature that pipeline is and its likelihood to close in the quarter.
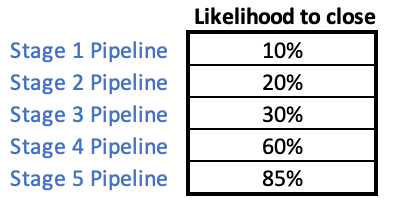
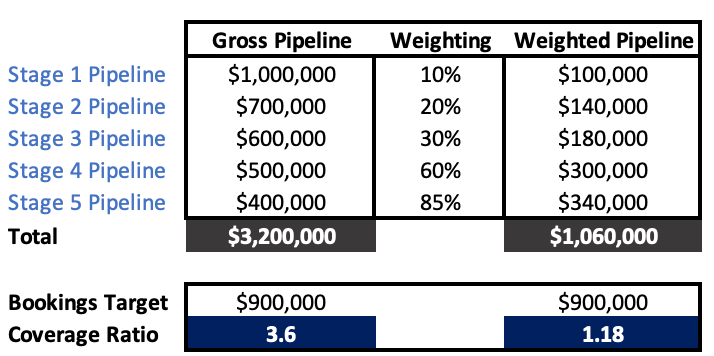
Let’s say that you have five (5) pipeline stages. You’ve labeled them stages 1-5 (from earliest to most mature). If you go back and analyze starting pipeline for a number of quarters, you can determine the likelihood of pipeline closing in-quarter from any given stage. Your analysis brings back results that looks like this:
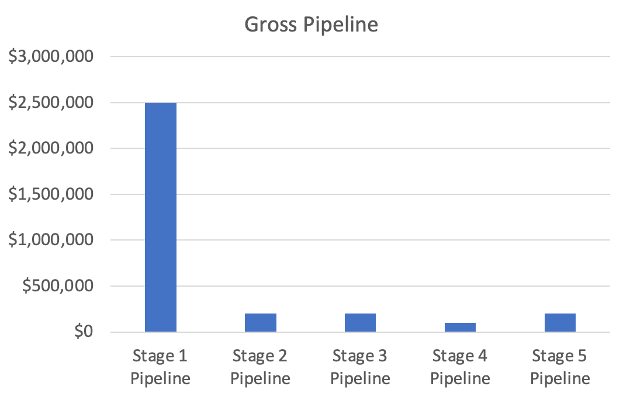
Visually, your starting pipeline looks like this:
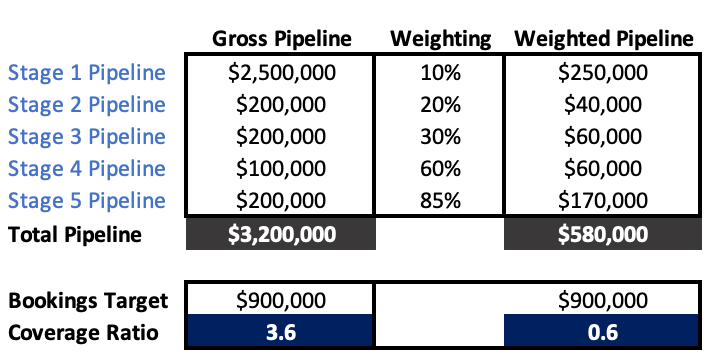
When you start looking at weighted pipeline (the likelihood to close) – you start to see something interesting. Your weighted pipeline – the amount that’s most likely to close – is nowhere near the gross number.
In fact you can see that under this scenario – you’re likely to only close about $580K (60%) of the quarterly target. So let’s talk about weighted pipeline.
Weighted pipeline forecasting is a common method used by many B2B SaaS companies to create more accurate forecast models. The approach involves assigning a probability of closing (our likelihood to close in the above example) to each opportunity in the sales pipeline, based on factors such as deal stage, customer engagement, and historical close rates. The weighted pipeline value is then calculated by multiplying the potential revenue of each opportunity by its respective probability of closing.
Weighted pipeline forecasting can provide a more accurate representation of the sales pipeline and help companies better predict their future revenue. However, its accuracy depends on the quality of the data and the assumptions made when assigning probabilities to each opportunity. Inaccurate probabilities or inconsistent data can lead to unreliable forecasts.
In the example I showed above – we took a simple approach (stage of deal) to create a weighting. For most companies this is a really good starting point. As your business matures – and you have many quarters of historical data – your weighting can get more accurate. You can look at how far along you are in the quarter and adjust weights based on that. You can apply a “customer engagement” factor to weightings (e.g. – if you have regular engagements with the EB – executive buyer, and a MaaP – mutual agreed (upon) action plan) – you can increase the likelihood of a particular deal closing.
A better starting pipeline for the quarter would look something like this (same gross pipeline):
When you are looking at weighted pipeline during the quarter – if the weightings add up to at least 1.0X – you should have a high likelihood to hit your number (assuming you’ve done the math behind the weightings correctly).
Are you all using weighted pipeline? I typically use it looking out on a four-quarter rolling basis and have an understanding from prior analysis what those ratios should look like at any given time in the year. I’ve found that it’s a far better indicator than just the gross coverage number of 3X, 4X, etc.
As always – ending with a shot of Ollie - this one is from his recent birthday celebration (turned 5).
Please let me know if there’s anything of interest you’d like me to cover!
Best,
Steve


