“Time Kills All Deals” is a phrase every sales executive knows and lives by. Knowing what’s happening to your time to close is one of the essential metrics that every revops organization should be tracking. Is it getting better? Getting worse? Staying the same? This metric is critical for planning demand generation planning and one of the key metrics used to measure the effectiveness of sales enablement.
So let’s look at an organization that has three sales segments – SMB, enterprise and strategic accounts and see what’s been happening to time to close in the past few years. Typically, you measure time to close from the moment a deal enters pipeline to the moment it ends up as closed won business. You should certainly be measuring the time it takes a deal to get into the pipeline (how time in MQL, SAL, etc.) – but that’s for a different discussion.
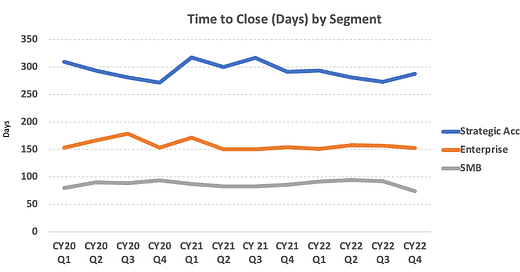
Let’s say the topline “time to close” chart for the whole business looks like this:
On the surface, things look pretty good. In the last few quarters, it looks like strategic has been trending down a bit (even though there was a slight uptick in CY22Q4), enterprise has been holding flat for quite a while and SMB has been rising a touch but had a nice downturn in CY22Q4.
Looking at the averages across the years, and comparing CY22 to CY20, we can see that SMB is flat, enterprise is down 5% and strategic is down 2%.
Depending on your industry – this may be good (or not). If you’ve been investing a lot in productivity tools and training, you might be expecting to see more. One of the most important lessons I always tell my team is to look below the averages. Aggregate averages like this can hide things that are happening. It’s always important to have this level of summary but many companies have multiple sources of pipeline, and it’s important to look at that as well as looking at just the aggregate #’s by segment.
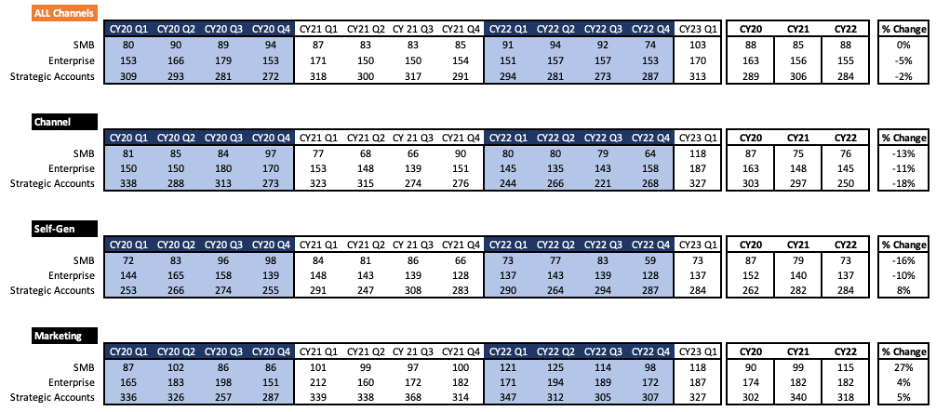
I like to look at it this way – by segment and by source over time (in numeric format as well as graphs). Here’s the time to close by quarter for the last three years by segment and source (channel, self-gen, marketing) along with average and % change from CY20-CY22.
Let’s look at channel for a minute. We’ve seen pretty good improvement in each year in every segment with time to close going down from 11-18%. That’s fantastic. It means the improvements we’re making in our channel infrastructure, systems, processes, and training are paying off.
Self-gen is a similar story in SMB and Enterprise. Improving the pitch, providing training on how to self-gen, putting tracking metrics and goals in place will help drive this down. We saw an increase in the strategic deals (from 262 days to 284 days) – so that bears further investigation.
Something else is going on in marketing though – we’ve seen time to close increase in every segment. Up 27% in SMB is alarming, especially when channel and self-gen are both down double digits. We need to dig in and figure out what’s driving this. Did our source of leads change? Did we change something in the qualification process for those deals? Is our marketing mix changing? Enterprise and strategic are up single digits – not nearly as bad – but again – we saw decreases in channel and self-gen so it again is worth exploring what we think is happening.
One thing to watch for when doing analysis like this is how many deals you are closing in a quarter. On the strategic side – if you are only close 2 or 3 deals in a quarter, you might be artificially increasing (or decreasing) the average time to close. Keep an eye on that – if you don’t have enough deals – flag the data and exclude it from the analysis (or heavily caveat it). You can also look at weightings (which I did not do for this analysis). For example – if channel represented 50% of your pipeline, self-gen another 35% and marketing only 15% - I would be a bit less concerned about the changes in marketing, but still want to understand what’s going on. In many businesses though, marketing represents a major source of pipeline so I would recommend absolutely digging into it.
I know I mentioned earlier that time to close is an important metric to understand the impact that enablement is having. I want to emphasize though that while this metric is important – there are others we need to focus on to really understand the impact that enablement has on sales productivity. Some of the other ones to look at include:
Time to productivity: The time it takes for new sales reps to become fully productive and contribute meaningfully to the organization.
Deal win rate: The percentage of deals that are successfully closed, which can indicate how well-equipped the sales team is to handle prospects and convert them into customers. We often look at deal win rate from a certain stage (more on this in another post).
Average deal size: The average monetary value of closed deals, which can provide insights into the sales team's ability to upsell or cross-sell products or services.
Sales quota attainment: The percentage of sales reps meeting or exceeding their sales quotas, which can demonstrate the effectiveness of the sales enablement program in helping reps achieve their goals.
We’ll explore each of those in more detail during the coming weeks. As always – ending with a picture of Ollie. It’s springtime here in Southern California and he’s enjoying the cool brick on the patio.
I hope you enjoyed this post. Watch for a very long post on how to create regions and territories coming out later this week.
Best,
Steve


